According to the US Census 2015 American Community Survey Philadelphia still has the highest bike commute rate among the 10 largest cities in the US, at 2.2 percent although in the past few years the City of Chicago has slowly chipped away at Philadelphia’s lead (1.8 percent in 2015).
In and around Center City, bicycle commuting appears to be correlated with population density. In these neighborhoods, denser census tracts typically have a greater proportion of residents commuting by bicycle.
Philadelphia’s dense neighborhoods are also characterized by narrow streets and a lack of arterial roadways which results in slower vehicular traffic. Watch the report after the jump.
BCGP bike counts were conducted by volunteers and staff members at 18 locations in 15-minute intervals over the two rush hour periods (7:30-9:00AM and 4:30-6:00PM) during September & October of 2016. (Read the entire bike count report here.)
The recently explosive growth of bicyclists in Philadelphia has slowed. BCGP count data shows that though bikes per hour (bph) over the Schuylkill River Bridges increased an impressive 30 percent in the five years from 2008 to 2012 (601 to 784 bph), traffic over these bridges only increased 12 percent in the five years from 2012 to 2016 (784 to 881 bph).
The South Street Bridge has the highest hourly counts: about 400 bikes per hour, carrying 45 percent of the bike traffic over the Schuylkill River between Center City and West Philadelphia. Before renovation of the bridge in 2009-2010, the South Street Bridge carried only 27 percent of the cross river bike traffic.
The entire bike count report is available here.
Overall sidewalk riding has dropped 35 percent between 2012 and 2016. Wrong way riding declined by 50 percent during the same time period.
While the data limited here, it is possible this decline may be that normalization of cycling in Central Philadelphia is diluting the rogue behavior. Some streets with high quality bicycle facilities do even better. For example wrong way riding on the South Street Bridge is virtually non-existent.
Better bicycle infrastructure continues to attract more bicyclists and better bicycling behavior.
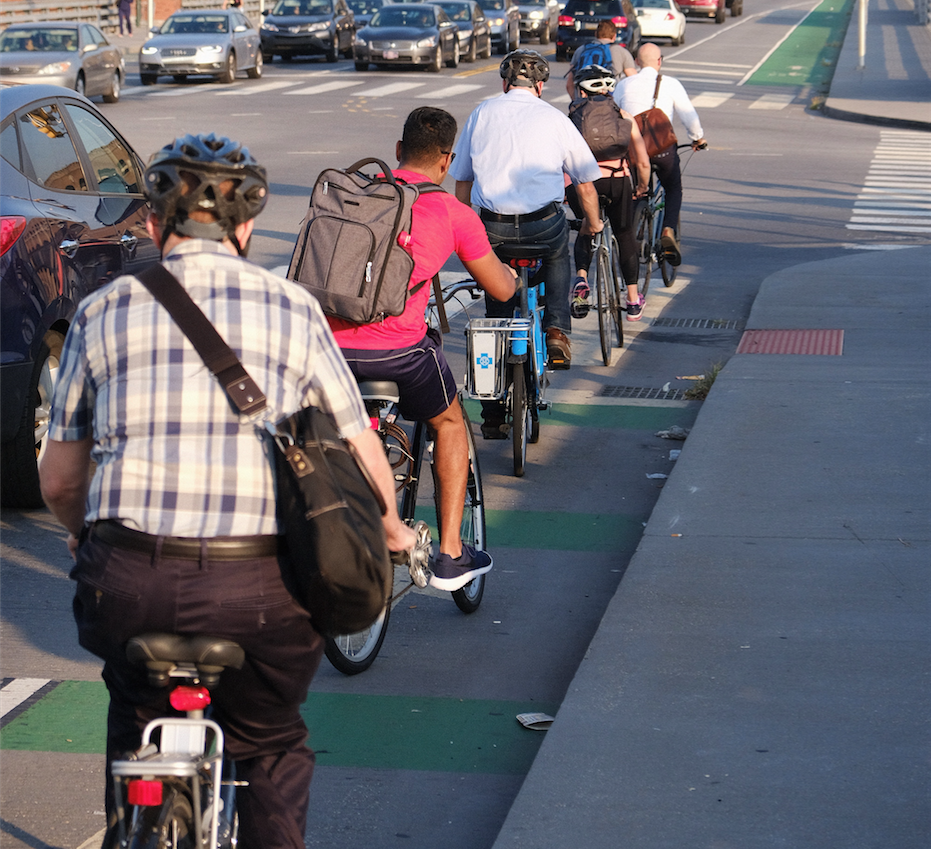
Bicyclists will ride where they feel safest; bikes per hour is highest on streets with high quality infrastructure. Streets with buffered bike lanes had over 200% more bicyclists per hours than streets with sharrows. Streets with buffered bike lanes had far fewer sidewalk riding and more female bicyclists than streets with no bike lanes.
Based on BCGP counts, bicyclists using Indego bikes rose from 4.3 percent to 5.7 percent between 2015 to 2016. Indego ridership rose between those two years mostly on streets with buffered bike lanes and streets with no bike lanes.
Philadelphia’s 2035 comprehensive plan and 2012 Pedestrian and Bicycle Master Plan set goals to increase the bicycle commute mode share to 6.5 percent by 2020; realizing this goal will require continued infrastructure investment citywide. BCGP supports Mayor Kenney’s pledge to add 30 miles of protected bike lanes and to continue to build upon the City’s bikeway network, especially along those corridors that make up BCGP’s proposed Hub & Spoke network of high quality bicycle infrastructure.