Part plan, part accomplishment report card, Philadelphia’s 2015 Pedestrian and Bicycle Plan was released in December and highlights many of the city’s goals for bicyclists and pedestrians over the coming three years.
Safer Streets
In 2014, Philly signed on to the U.S. Department of Transportation’s “Safer Streets, Safer People” initiative. Its goal is to focus on safety issues for non-motorized transportation and assist communities in creating better-connected networks for cyclists and pedestrians. And on a matter of public health, the U.S. Surgeon General put out a call to action in 2015 for the nation to increase physical activity.
Mode Share
Mode share, or the percentage of travelers using a particular type of transportation, is a big part of analyzing the breakdown of how people are getting around. Between those who walk and cycle, pedestrians outweigh cyclists in all 18 studied areas of the city. The full breakdown can be found on page 5 (report is below) and there are some areas of note.
The Central District and Southwest University City have their pedestrian levels at 30% and 23.1% respectively. The highest level of cyclists can be found in the Central, South, and Southwest University City. Those areas have 4.9%, 6.5%, and 6.2% respectively.
Bike Share
Indego, a city wide bike-share program, was launched in April 2015. Its 73 stations were installed throughout the city with a goal of giving the possibility of affordable bike rentals to those who don’t normally have access to a bicycle. With additional funding from the William Penn Foundation, Indego will be installing 30 more stations in the Spring of 2016.
Women
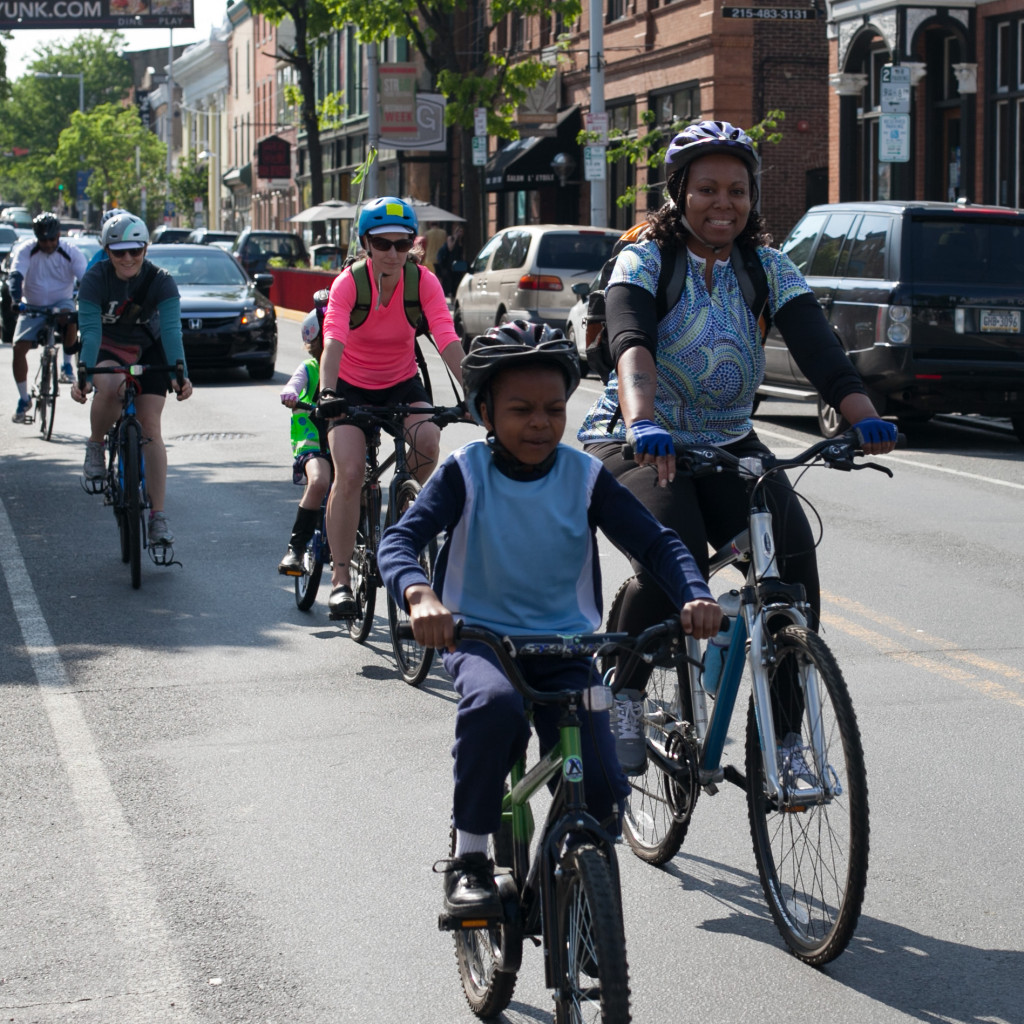
Our program, Women Bike PHL has been working to lower the gender gap of cyclists and to make cycling more accessible and safer for women. A recent study shows that about 39% of cyclists in Philly are women. This program is working to make it an even split between men and women.
Future Goals
By the year 2020, there are a number of targeted outcomes that this plan wants to achieve. Notable statistics from the 2015 progress report are in the areas of safety and increase in cycling and pedestrians. From 2010, cyclist fatalities went down by 25% and injuries went down by 5%. Pedestrian injuries went down by 5%. Sadly pedestrian fatalities increased by 17%. The plan’s goal to increase cycling to 6.5% is currently at 1.99% and the goal to increase walking to 12% is at 8.48%.
There are a number of notable projects under way meant to improve safety measures for the city’s pedestrian network.
Walkability
Last year, the city received $1 million from the Pennsylvania Department of Transportation from its Automated Red Light Enforcement Grant Program. These funds, generated by the city’s red light cameras were put towards safety improvements for all road users.
Improvement to walkability and access to commercial corridors is another area of focus. Projects in various stages of development are underway in areas of Girard Avenue in Brewerytown and the bustling convergence of 12th Street, Morris St, and Passyunk Avenue. These improvements include new sidewalks, new curbs, safety improvements, improved street lights, ADA ramps, more trash receptacles and bus shelters.
Improving sidewalk conditions is a high priority for the upcoming years. New construction around the city has lead to a welcomed decrease in poor and missing sidewalks and has decreased from 61 to 42 percent. Areas of current attention by the Streets Department are on low-income areas where newer developments are not improving the sidewalks. Right now, sidewalk maintenance is the responsibility of the adjacent property owner and can be an issue is areas where vacant land is more prevalent.
Bike Infrastructure
Much like the process of improving walking conditions, the improvement of the city’s bike infrastructure takes a lot of time, money, and coordination between many groups but when projects are implemented, safety conditions for all are drastically improved.
Since 2012 the number types of lanes has increased to include climbing lanes on Ridge Avenue and Midvale and contraflow in University City. The total amount of lanes across all types increased from 428.4 miles in 2012 to 498.2 miles in 2015.
For upcoming bicycle network expansion, the city its priorities set into two tiers. The first includes 45 miles which respond to the needs of network improvement. These are the ones which are currently funded or under consideration for state funding applications. The second includes 65 additional miles which will further increase the connectivity of the network.
The upcoming improvements are not without their challenges. As the plan states, one of the biggest issues is a lack of understanding of current planning and regulations. To attempt to remedy this, the Streets Department is planning on creating a Bicycle Program webpage for the public which will operate as a central information source for all bike-related issues. It states that this site will include bike maps, plans, upcoming projects, road rules, an education and outreach materials. Check out the entire report below.
-Zach Mentzer