

All summer 2016, local software company Azavea has been working with the Bicycle Coalition of Greater Philadelphia, creating an interactive map image to determine whether traffic crashes in the city specifically correlate to indicators of potential disadvantage among residents.
The work was done through Azavea’s Summer of Maps program, a three-month long fellowship giving student GIS analysts the opportunity to perform geospatial data analysis for local and national non-profit organizations.
This year fellow Carlos Bonilla compared crashes per square mile with Indicators of Potential Disadvantage (IPD). IPD is a census map tool developed by the Delaware Valley Regional Planning Commission. DVRPC looks at different demographics that may have specific planning-related issues or challenges. DVRPC analyzes eight Indicators of Potential Disadvantage (IPD) within census tracts in the 9 county DVRPC region.
- Poverty
- Non-Hispanic Minority
- Hispanic
- Elderly (over 75 years old)
- Carless households
- Physically Disabled
- Limited English Proficiency (LEP)
- Female Head of Household with Child.
DVRPC uses the regional average for these indicators as a baseline. Any category that meets or exceeds this average is given a point for that indicator. Therefore every Census Tract in the DVRPC region has a IPD value of between 0-8.
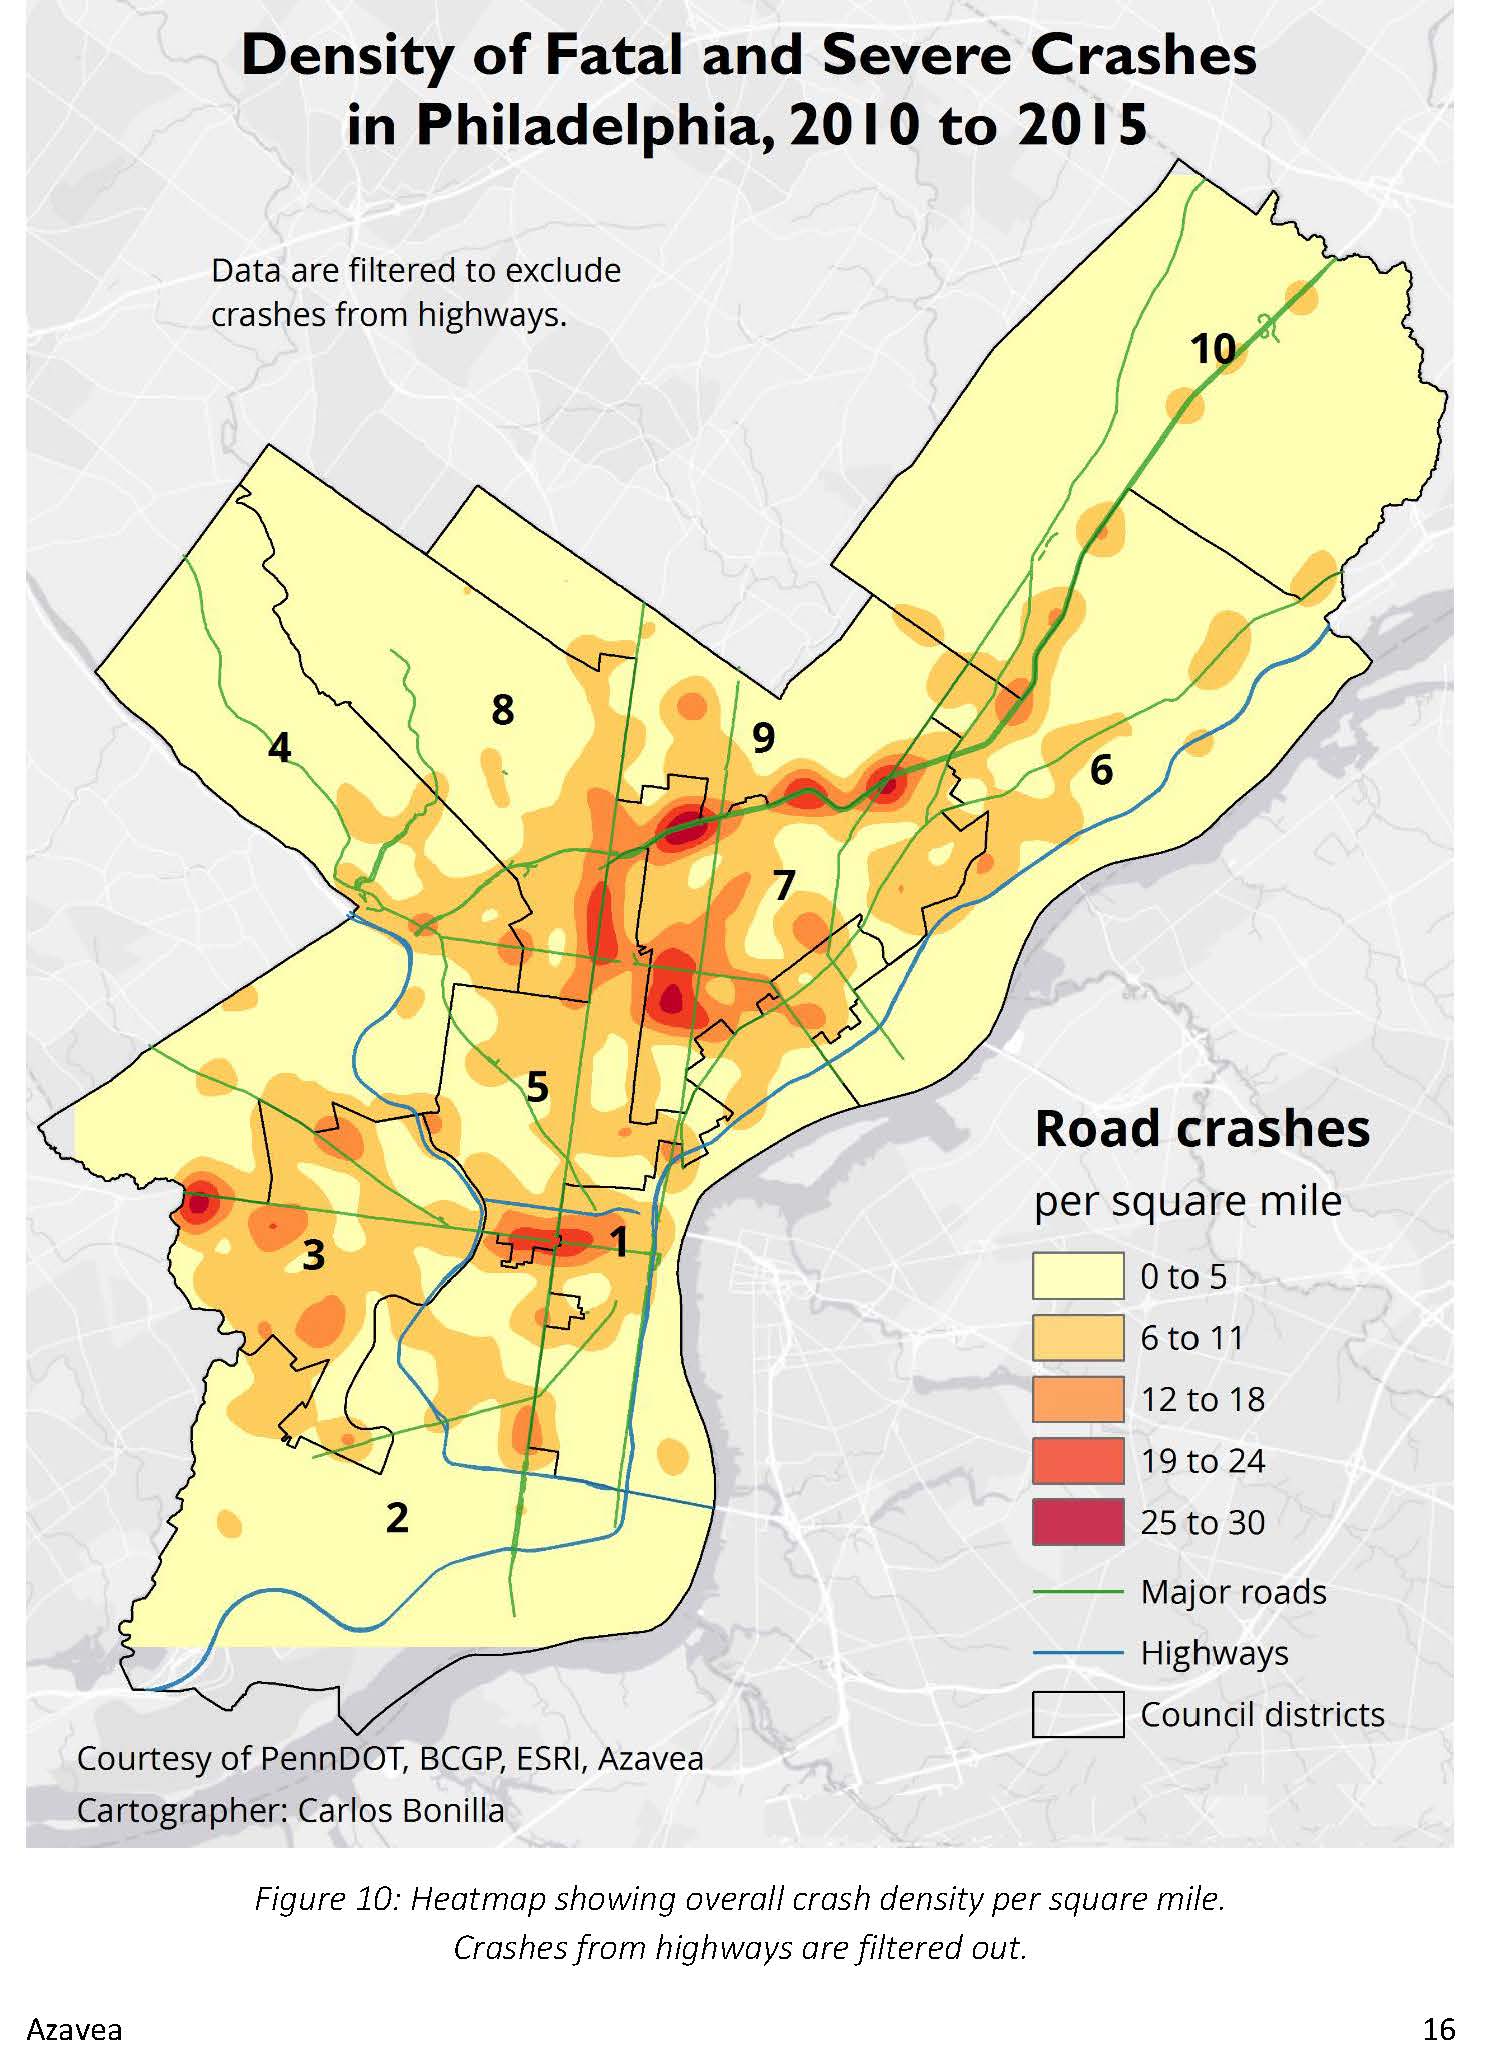
However Azavea did not find a particularly strong correlation between any of the indicators and crashes per square mile. What they did find however is that some neighborhoods, particularly in North Philadelphia’s Fair Hill had clusters of high crashes away from Roosevelt Boulevard. Overall the highest concentration of crashes were in the 7th District, which also as a district also had the highest IPD score.

Azavea also did a similar project for Transportation Alternatives that looked only at poverty and crashes and did find a correlation between the two factors in New York City. Once it’s made public we’ll take a look at the New York data to see what we can learn from it.
The Bicycle Coalition would like to thank Carlos Bonilla and the support staff at Azavea for allowing us to dig deeper into the crash data at no cost.
We also look forward to applying for future Summer of Maps calls for projects in the coming years. Click the links below to dig deeper into the data.
Interactive Maps